Startup Financial Modeling, Part 3: The Income Statement and Custom Detail Tabs
This article was originally posted on Startup Rocket here, and written by Will Little and Troy Henikoff.
In the first two posts in this series, we examined why building a financial model for your startup is important and how to practically get started with your assumptions tab. Today, we’ll continue by diving into the income statement and supporting tabs used to calculate your projected revenue and expenses.
But first, in case you aren’t yet convinced that it’s worth your time to build a financial model for your business, here’s a quick video we put together showing how a model can be used to gain insight about what assumptions drive forecasted cash most significantly:
We’ll discuss these types of learning nuances in more detail in our next (and final) post in this series. But first, we have some work to do in order to fill out the model.
Start by Building your Monthly Income Statement
To dive right in, assuming you’ve already created your first tab called “Assumptions”, create a second tab called “Monthly Income Statement” and begin to set it up like this:

Copy that formula in D2 and paste it into the next 58 columns in row 2 in order to set up 60 months (i.e. 5 years).
Next, we’ll focus on revenue. Starting in row 4 you’ll want to list the high-level revenue streams for your business.
For example, with Dollar Cave Club (the demo business we introduced in the last post), we are planning on four revenue streams:
- Subscription
- Add-ons
- eCommerce
- Advertising
We’ll write these in cells B4-B7, and in order to begin filling in cells C4-C7, we’ll need to ask ourselves how will we calculate our forecasted revenue for month one. This, as you may suspect, requires starting a new tab.
Sales Detail
Create a new tab called “Sales Detail” and, from top to bottom, fill in the rows needed to roll up calculations for each revenue stream. This is where your spreadsheet will become unique for your business. As a guide, however, here’s what it looks like for Dollar Cave Club:
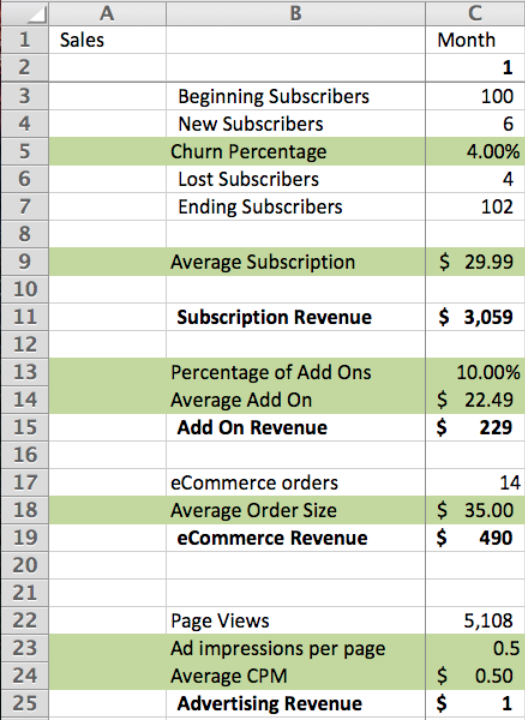
Note that we are using the necessary sub-rows to calculate the total for each revenue stream per month (i.e. rows 11, 15, 19, and 25).
From top to bottom in month 1 (i.e. column C), you’ll want to start with your actual numbers (or assumptions if you don’t have numbers yet) and fill in each cell appropriately with formulas using your assumptions, and – you guessed it – any additional custom detail tabs you need.
Right out of the gate here with our example business, in order to calculate the number of New Subscribers in month 1 (i.e. cell C4), we’re going to need to create another custom tab around traffic numbers to handle this calculation.
Traffic Detail
In order to calculate the number of new subscribers in month one, we’re going to need to add up anticipated traffic numbers from paid search (SEM), organic search, Facebook, direct, etc… (i.e. it will, again, be custom for your business).
Here’s what it looks like for Dollar Cave Club:
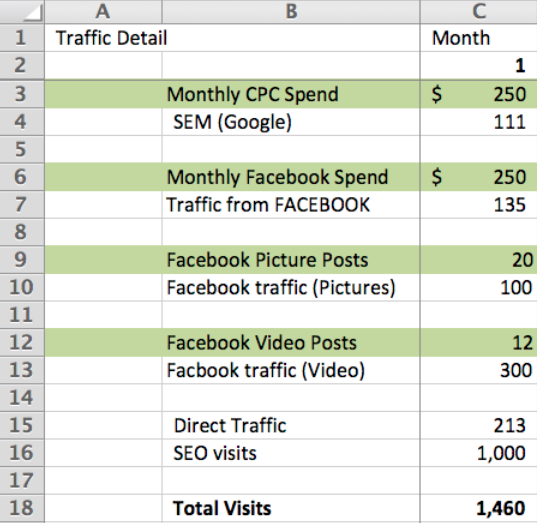
If you recall our initial Assumptions from the last article, here is where you’ll pull in variables like AverageCPCGoogle (for C4’s formula), AverageCPConFACEBOOK (for C7), VIsitsPerFBPicturePost(for C10), VisitsPerFBVideoPost (for C13), DirectTrafficMultiplier (for C15), and OrganicTrafficMonthlyGrowthRate (for D16 and beyond), etc…
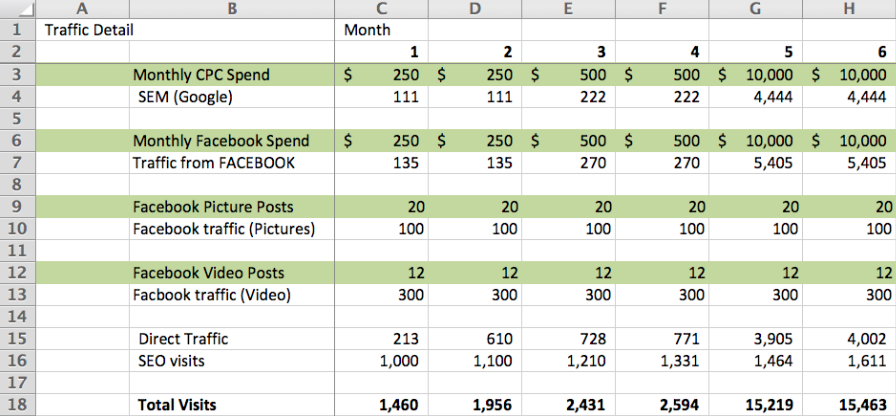
Importantly, after a few months of testing, we’ll assume in this model that we’ll get to SteadyStateMonthlySEMSpend (i.e. $10k) and also apply that to our Facebook channel (see G3/H3, and G6/H6). This, for the purposes of our demo model, will then carry forward through our 60 months.
Back to Sales Detail
Now that we have our Traffic Detail filled out, we can go back to our Sales Detail and finally fill out C4 there (i.e. New Subscribers).
That formula will look like:
=ROUND(‘Traffic Detail’!C4*SEMToSubscriber + ‘Traffic Detail’!C7*FacebookToSubscriber + SUM(‘Traffic Detail’!C15:C16)*OrganicToSubscriberConversion,0)
…which will then be applied to the rest of row 4 and allow us to, using the proper assumption values, calculate our Lost/Ending Subscribers and ultimately our Subscription Revenue, which is what is then rolled up to our Monthly Income Statement for the C4 cell that started us down this rabbit trail to begin with.
Thus, to summarize, the blue values below are taken from our assumption values (inputs) and the formulas are calculated like so:
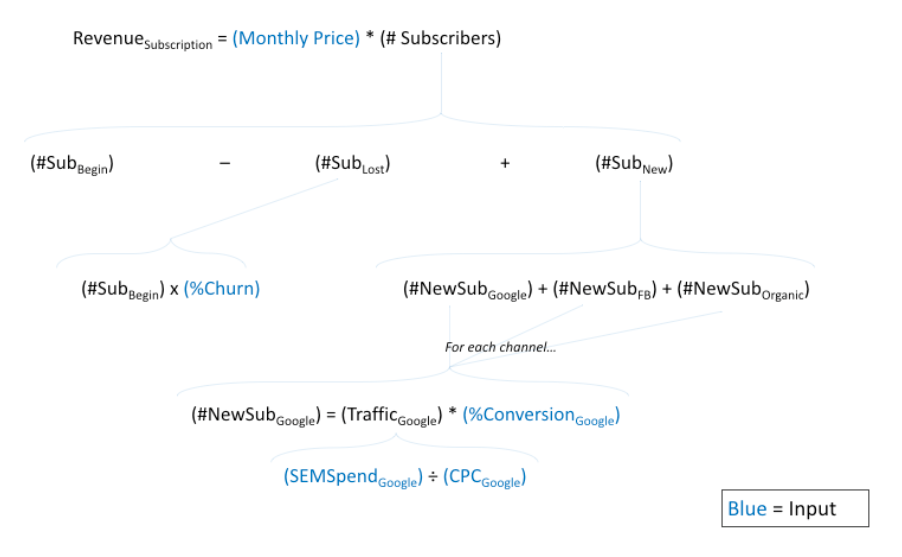
The other revenue stream totals can then be calculated similarly from our traffic detail tab and assumption values, which allows us to calculate Gross Revenue numbers on our income statement.
Back to the Monthly Income Statement
Now that we have the Sales Detail tab filled out, we can roll those numbers into our forecasted revenue cells like so:
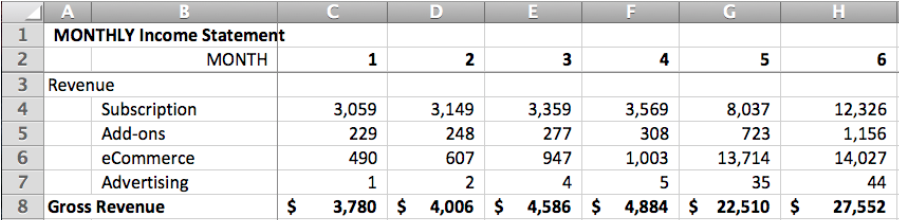
And there we have it. Copy the formulas across the 60 columns and total them up into your Gross Revenue row.
Now we can turn our gaze to costs.
Direct Costs
The bottom rows of the Income Statement will then examine the costs associated with running our business, and – similar to how we worked it for revenue – we’ll need to create custom tabs when appropriate.
For direct costs associated with the stuff we sell (versus indirectcosts like salary and rent and such), we can add them in like so:
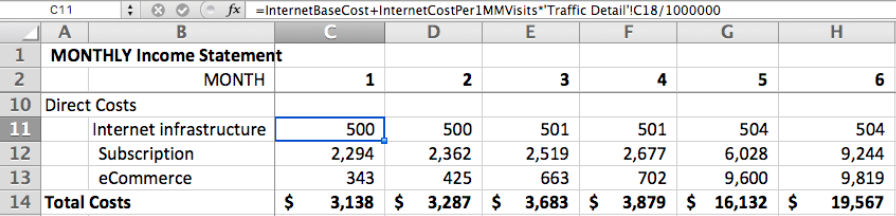
Note the formula for C11, which adds our assumed base cost to a scale factor applied to our traffic that we pull in from our Traffic Detail page. Our Subscription and eCommerce values are then calculated from our SubscriptionMargin and eCommerceMarginassumptions.
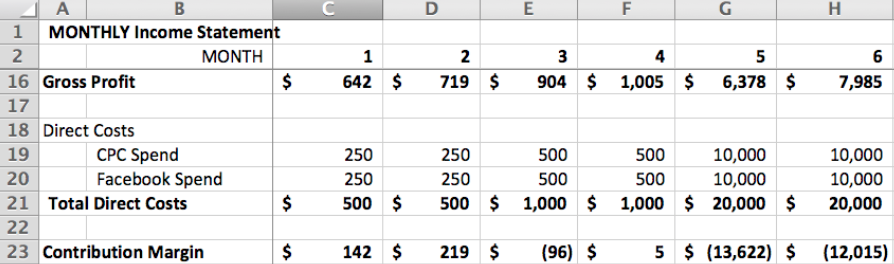
We can continue then by tallying our Gross Profit (i.e. C8 minus C14), add in our direct costs from Google and Facebook ads (pulled in from the Traffic Detail tab), and calculate our Contribution Margin (i.e. revenue minus direct costs).
Indirect Costs
Finally, we’ll finish up the costs part of our income statement with some standard indirect costs for example purposes:
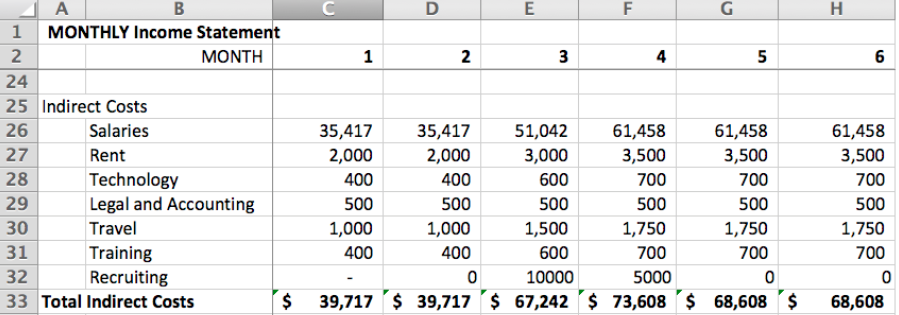
Since these costs are calculated from the number of employees we expect to have, and the details of their salaries and benefits/taxes, this warrants the creation of a new tab.
The Employees Tab
Create a new tab called – you guessed it – “Employees”, and add in the details that are custom for your business. Like any detail tab, it really can be formatted however you’d like as long as you can send back up the numbers needed, but here is an example of how we did it for our demo company:
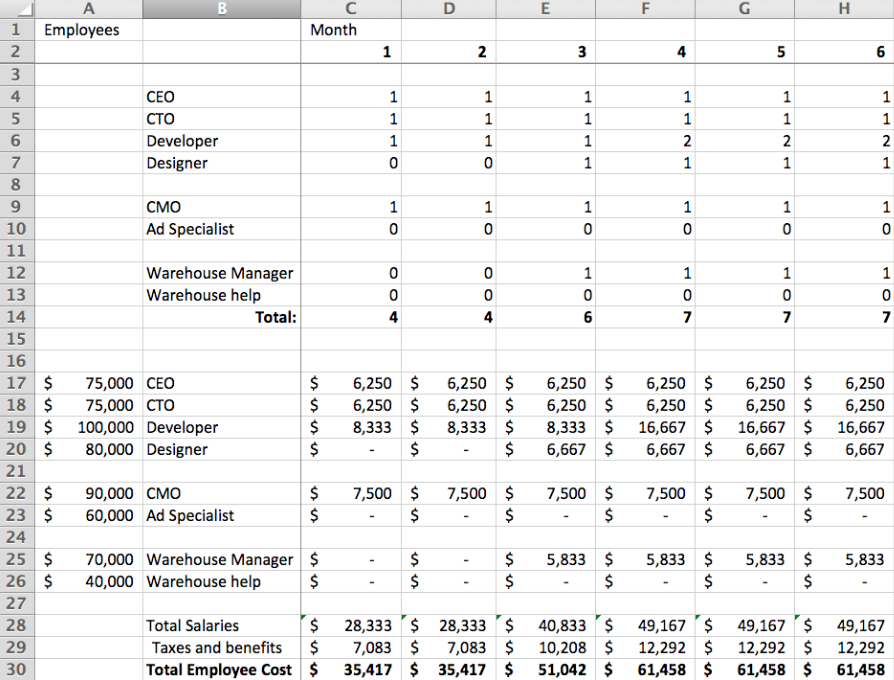
While most of this tab is pretty straight forward (and obviously the salary numbers will adjust based on your market), one thing to note in here is how we defined “Warehouse help” to increment based on volume, like so:
=ROUND((‘Sales Detail’!C7+’Sales Detail’!C17)/OrdersPerWarehouseHelpPerson,0)
In other words, as sales increase, we’ll add warehouse help based on our assumed OrdersPerWarehouseHelpPerson value. With our current assumption values, this starts to increment in month 22, but you can see how if things pick up, we’ll need to hire this person earlier.
Finishing with EBITDA and Notable Mentions
Finally, to finish off our income statement, we’ll add in:
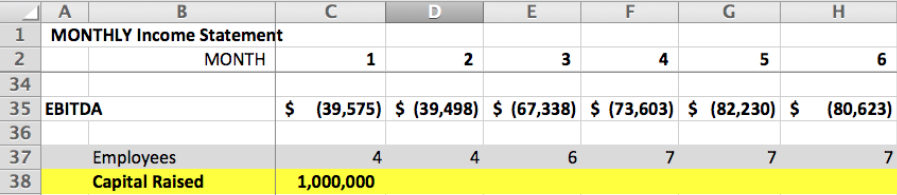
For those unfamiliar with the term, EBITDA stands for Earnings before interest, taxes, and amortization, which is a sufficient number to end with here for financial modeling purposes.
You can also add in notable mentions like the number of employees, capital raised, important KPIs your are tracking, etc…
Follow the Principles, Don’t Just Copy What you See
We’ll of course provide a link to the full demo spreadsheet at the end of this series. While you can (and should) study other financial models to use as additional guides, it’s critically important for you to understand the principles behind what is going on here.
In short, start with the Monthly Income Statement and then go row-by-row, cell-by-cell and create custom detail tabs (and custom sub-detail tabs) as needed to perform the necessary calculations to keep your income statement clean.
Originally published on the MATH Venture Partners blog.
13 Comments
Comments are closed. These were carried over from the original post.